YearlyQuest, your year as a heatmap
Track any habit, mood, or metric as a year-long heatmap calendar you fill in one tap at a time.
I have always liked the GitHub contribution graph, the little grid that turns a whole year of activity into one thing you can see at a glance. YearlyQuest is that idea pointed at anything you want. You define your own trends, a habit, your mood, sleep, whatever, each with its own colors, then tap one square a day. A year of it becomes a heatmap you can actually read.
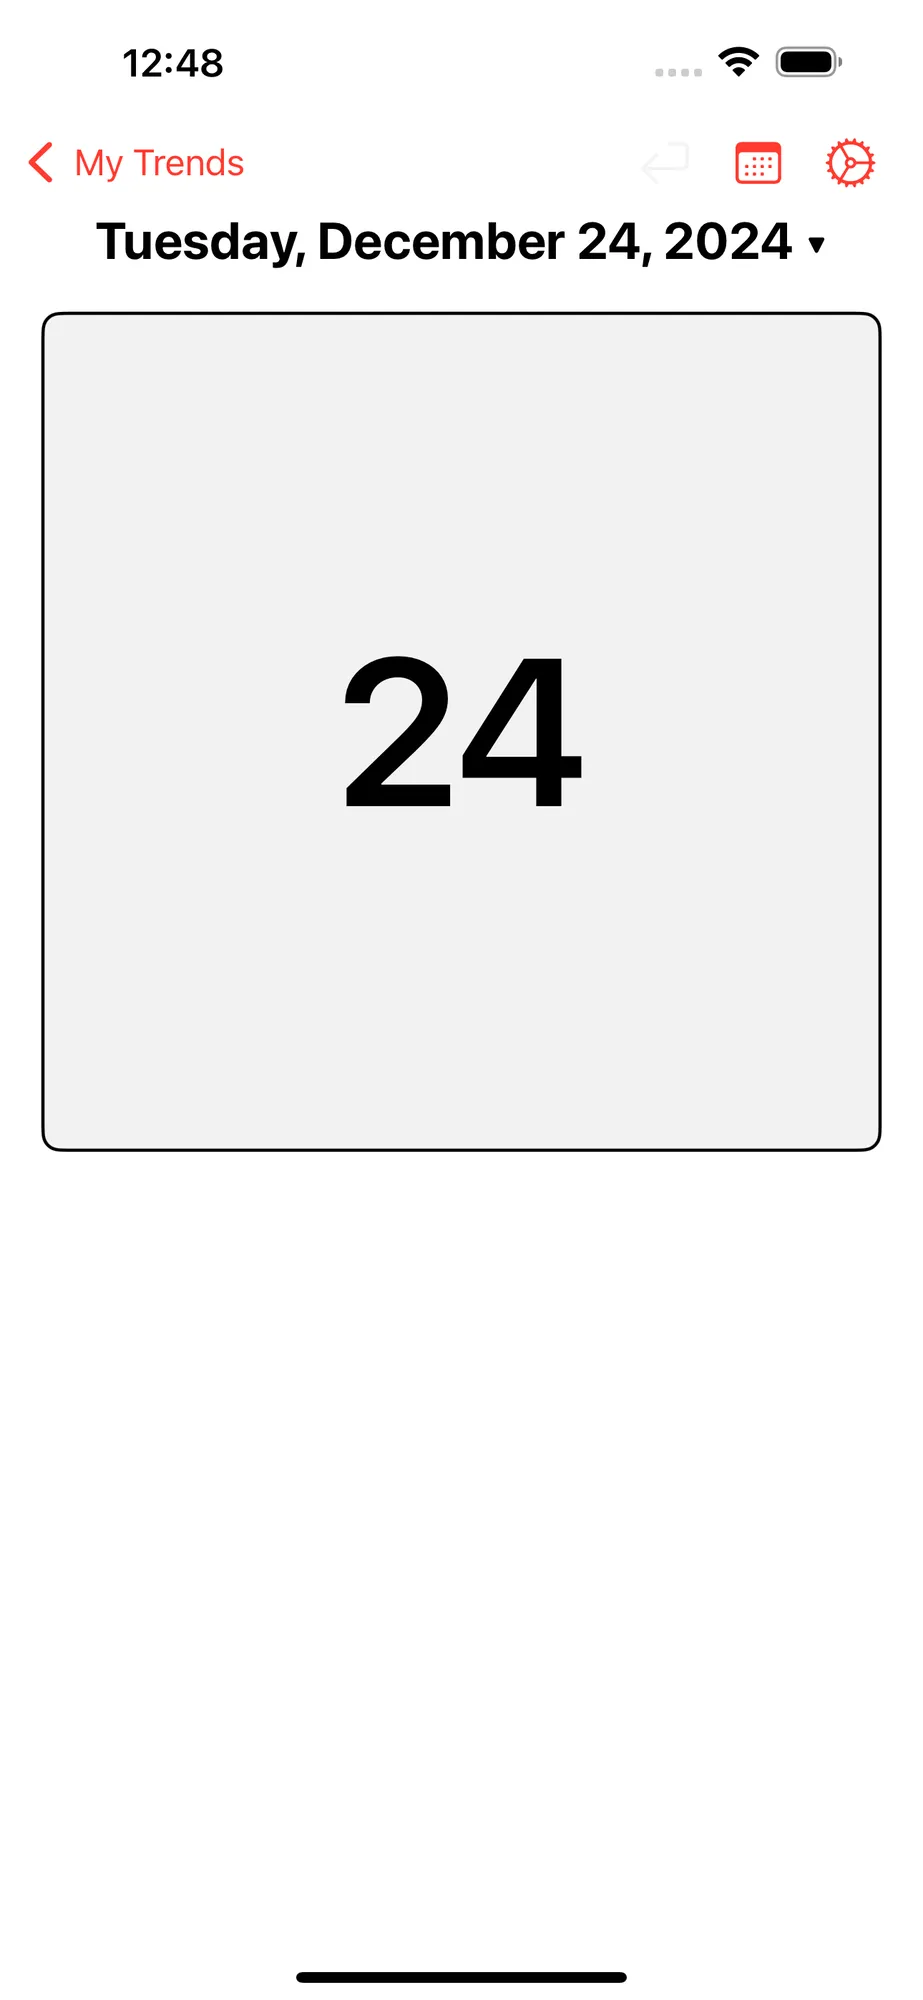
It was my excuse to really learn SwiftData, and to wire up Siri and Shortcuts so you can log a day by voice. The thing it taught me: the hard part of a tracking app isn’t the tracking, it’s making the logging take one second, because that is the only way you actually keep doing it.
It’s at yearly.quest.